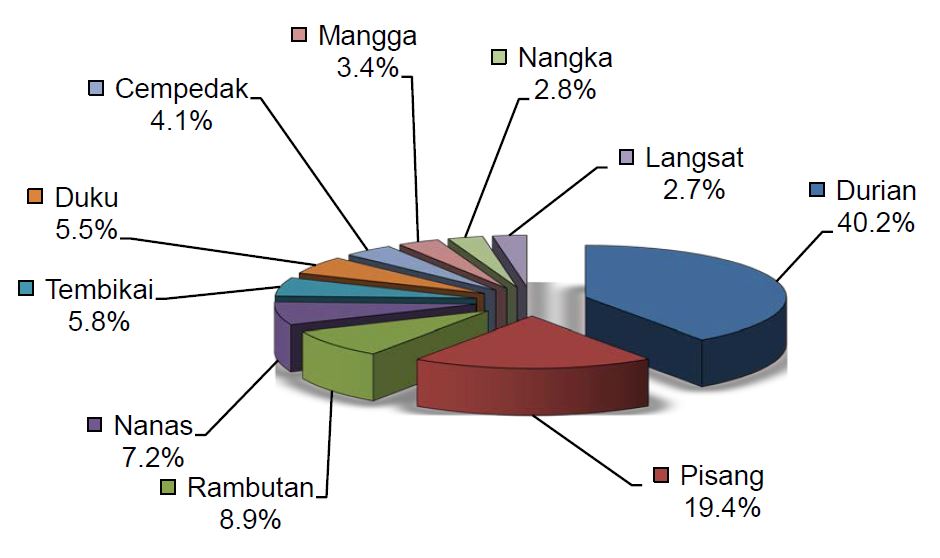
The Highest Hectareage for Ten Fruit Crops, Malaysia, 2017
The total planted area for Malaysia fruit crops (21 in totals) is about 208,590 ha in 2017 but only 60.4 % (126,005 ha) is used for production. There were 1.49 million metric tonnes of local fruits produced with an average production of 11.8 mt/ha in 2016. The pie chart shows the percentage area planted with nine selected fruits. Durian is the most popular crop planted in Mlaysia making up 41% of the land cultivated or about 73,000 hectares. This is followed by bananas (20% - 35,000 mt/hectares), Rambutans (9%), Pineapples (7%) and other fruits (below 6%). The main durian plantations are found in East (Pahang) and South (Johor) of Peninsular Malaysia. Durian has achieved full sell-sufficiency level of more than 100% and currently at 102.7%. The per capita consumption has also increase from 9.1kg/year (2015) to 10.8 kg/year (2016) indicating an increased demand for durian.
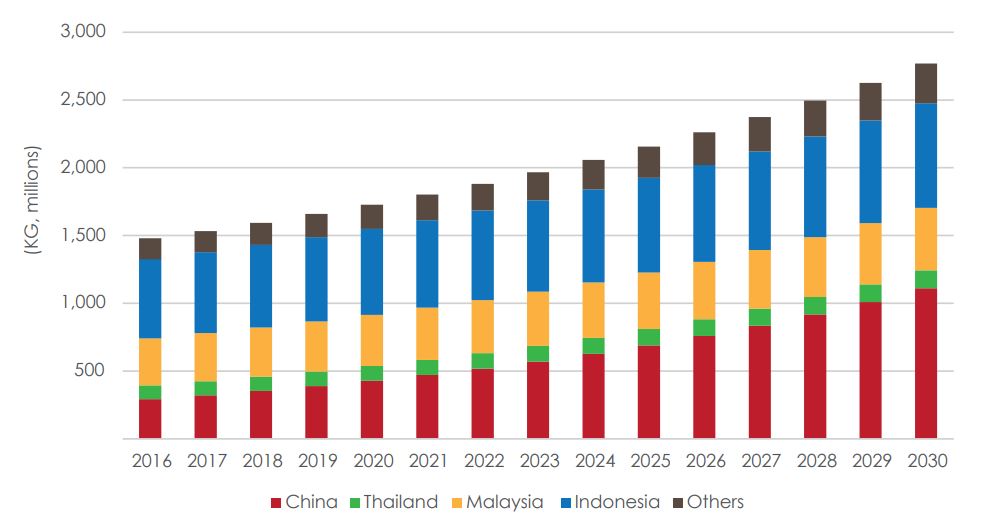
Total trade for Durian fruit is expected to grow from approximately 1.5 billion KG in 2016 to over 2.7 billion KG by 2030 in our conservative scenario. Our growth scenario which is highly plausible as well, expects trade to reach 4.5 billion by 2030. In terms of USD value, trade is expected to rise from 15 USD billion in 2016 to over 35 USD billion by 2030. Our growth scenario expects trade to reach 90 USD billion by 2030. Consumption per capita in China under the conservative and growth scenario is expected to reach 0.78 KG and 1.46 KG, respectively. Population growth was based on growth figures provided by the United Nations under their medium growth variant scenario. Chinese consumption under both growth scenarios still lags other regional countries. China is expected in the long term to reach a consumption level of 3 KG per capita to be in line with Taiwan and Singapore. Global trade has been identified as global imports plus the domestic consumption of the key markets of Thailand, Malaysia and Indonesia. Total future trade was calculated based on three key subsectors of data and markets– high growth, growth and mature growth markets. Figure 16 indicates the assumptions behinds the growth projections.